Fix Routing, Not Hiring: 2026 Support Response Time for Small Teams
August 29, 2026
Support response time is the clock that starts when a customer reaches out and stops the moment a human (or a genuinely helpful AI reply) actually addresses the issue. For 2026, treat these as your headline targets: email averaging a few hours with best-in-class teams responding significantly faster, live chat under about a minute with elite teams responding in under half a minute, and phone answer speed typically within about half a minute to a minute range. Check your median first response time (FRT) per channel and your 90th-percentile (P90), not just the average.
TL;DR:
- Most teams should focus on maintaining median first response times below one hour for email, under 60 seconds for live chat, and under 20 seconds for phone support to meet best-in-class standards.
- Tracking the 90th percentile alongside median FRT is essential to understand worst-case experiences, as outliers significantly impact overall customer perception.
- Automation, unified inboxes, and skills-based routing are critical structural improvements for reducing FRT more effectively than simply adding staff.
- Response time metrics must be measured during business hours and exclude automated acknowledgments to reflect true customer wait times accurately.
- Speed of first reply has a stronger correlation with customer satisfaction than resolution time, making rapid acknowledgment a key priority for loyalty and NPS.
Table of Contents
- What Is Support Response Time? Key Metrics Explained
- Support Response Time Benchmarks by Channel and Industry
- How to Measure Support Response Time Correctly
- Tactics That Actually Reduce First Response Time
- SLA Targets and How to Monitor Them
- Quick Wins: A Two-Week Response Time Action Plan
- Why Faster Replies Build Customer Loyalty
- How Response Time Drives Churn, NPS, and Revenue
- Tools for Tracking Response Time Trends
- Coaching Agents to Respond Faster Without Cutting Corners
- Speed vs. Quality: Finding the Right Balance
- The Real Lever Behind Faster Support (An Editorial Take)
- Sources
- FAQ
What Is Support Response Time? Key Metrics Explained
Before you can improve anything, your team needs to agree on what you’re actually measuring. This is where most support operations quietly fail: managers report one number in the weekly meeting while agents are optimizing for a different one entirely.
First response time (FRT) is the time between a customer’s message and the first substantive reply from a human agent or an AI response that meaningfully addresses the issue. An auto-reply that says “we got your message” doesn’t count. Zendesk’s guidance on FRT measurement is explicit on this point: automated acknowledgments should never stop the FRT clock, because they don’t answer anything.
Resolution time, often tracked as mean time to resolution (MTTR), is a separate and equally important clock. It measures how long the entire issue takes to close, not just how fast someone said hello. Customerexperience suggest standard B2B tickets should resolve within one business day, while high-priority issues need to close in 4 to 8 hours. Report FRT and resolution time together, never one without the other, because a team can post a fast FRT while still leaving customers stuck for days before actual resolution.
First contact resolution (FCR) tracks the percentage of tickets solved in a single interaction, with no back-and-forth. It matters because a fast first reply followed by five slow follow-ups is worse than a slightly slower reply that actually solves the problem.
On the math: use the median, not the mean, as your headline number. A handful of outlier tickets (a server outage, a holiday backlog) will distort an average far more than a median. Add the 90th percentile (P90) to see your worst-case customer experience, since tracking P90 alongside median exposes the long tail that a clean average hides.
Quick reference for your internal documentation:
- FRT: time to first substantive human or AI reply, excluding auto-acknowledgments
- Resolution time / MTTR: time from ticket open to full resolution
- FCR: percentage of tickets closed on the first interaction
- Median: the midpoint value, resistant to outliers
- Mean: the average, useful for spotting overall workload trends
- P90: the value 90% of tickets beat, your worst-case indicator
Support Response Time Benchmarks by Channel and Industry
Numbers only mean something in context, so here’s where the channels actually land in 2026.
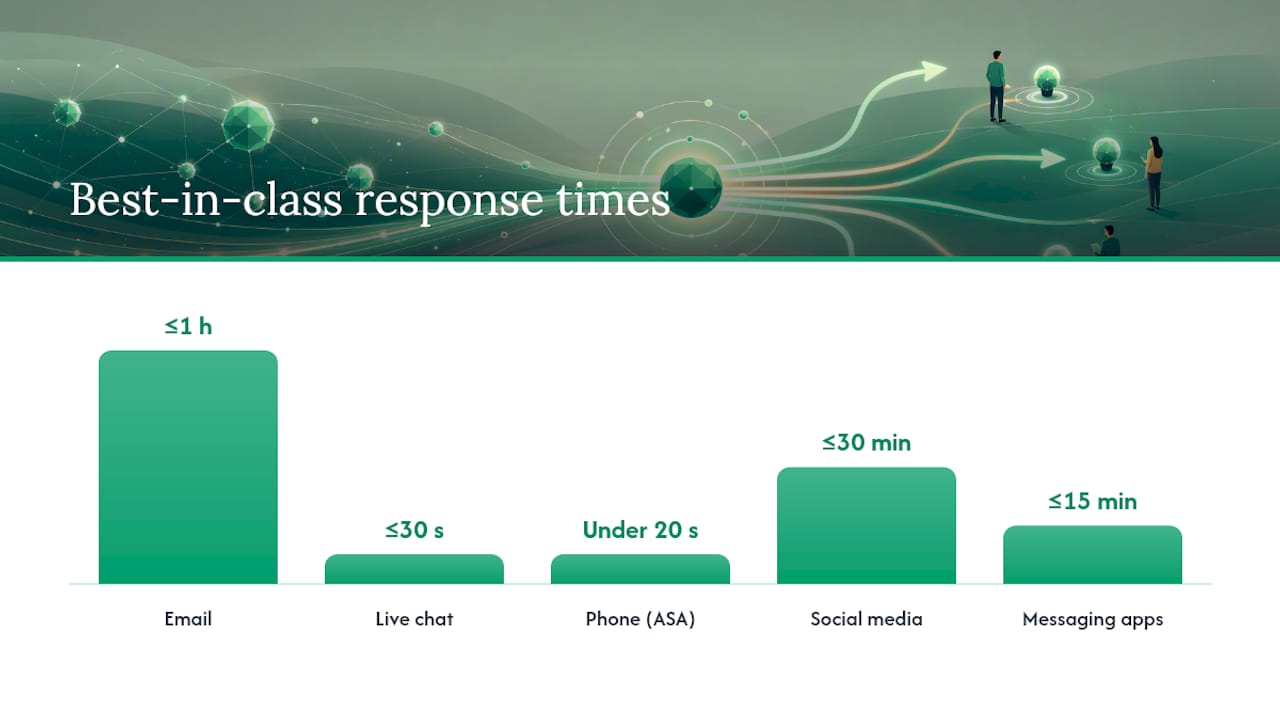
Email remains the slowest channel by nature and by customer expectation. The SuperOffice benchmark study puts the industry average email response time above 12 hours, even though most customers expect a reply within 4 hours. That gap is the single biggest opportunity most support teams are sitting on. TidySupport’s 2026 benchmarks report a median email FRT closer to 4 hours across industries, with top-performing teams answering in under 2 hours using unified inboxes and automation.
Live chat runs on a completely different clock because customers are watching the screen in real time. Channel benchmark data from Converge puts strong chat performance in the 30 to 40 second range, with acceptable performance up to about 2 minutes before abandonment risk climbs sharply.
| Channel | Acceptable | Good | Best-in-class |
|---|---|---|---|
| ~24 hours / 12hr average | ≤4 hours | ≤1 hour | |
| Live chat | ≤2 minutes | ≤60 seconds | ≤30 seconds |
| Phone (ASA) | ≤90 seconds | 20 to 60 seconds | Under 20 seconds |
| Social media | ≤4 hours | ≤1 hour | ≤30 minutes |
| Messaging apps | ≤2 hours | ≤30 minutes | ≤15 minutes |
Industry context shifts these targets. SaaS and e-commerce customers tend to expect the tightest turnarounds, since a slow reply often means an active buying decision stalls or a paying account starts evaluating alternatives. Education and government-adjacent support tend to run looser, partly because ticket volume spikes around enrollment and fiscal deadlines, and partly because customer expectations are calibrated differently.
Speed and satisfaction move together almost linearly. Research comparing first response time against resolution time finds that FRT correlates more strongly with customer satisfaction (CSAT) than total resolution time does. A customer who hears back in under 5 minutes tends to rate the entire interaction far more favorably, even if the actual fix takes a while longer. That’s a counterintuitive finding worth sitting with: the acknowledgment of a problem often matters more to perceived quality than the speed of the fix.
How to Measure Support Response Time Correctly
Most FRT dashboards lie a little, not through fraud but through sloppy configuration. Fix the measurement before you touch the workflow, or you’ll be optimizing for a number that doesn’t reflect reality.
- Measure in business hours unless you explicitly promise 24/7 coverage. A ticket filed at 11 PM shouldn’t count against your team if support closes at 6 PM. Configure your help desk to pause the FRT clock outside operating hours.
- Exclude automated acknowledgments from the stop condition. Only a reply that addresses the customer’s actual issue, whether from a human agent or an AI system, should stop the FRT clock. This is the single most common way FRT numbers get inflated with false wins.
- Report median as your headline metric, with mean and P90 alongside it for full visibility. Mean shows workload strain; P90 shows the worst experiences customers are actually having.
- Track SLA attainment as a percentage, not just the raw time figures. “94% of tickets met SLA” tells a manager something a single median number cannot.
- Define ticket eligibility clearly. Exclude internal notes and ops tickets from the calculation, and pause the clock during legitimate “waiting on customer” status, but audit that status regularly.
That last point deserves emphasis. Pause-the-clock policies for customer-pending tickets need to be auditable, because resolution time methodology guidance warns that agents can quietly mislabel ticket status to hide slow cases from the metrics. If your “waiting on customer” bucket is growing faster than your ticket volume, someone is gaming the dashboard.
Pro Tip: Pull a random sample of 20 “waiting on customer” tickets each month and manually verify the pause was legitimate. It takes fifteen minutes and it’s the fastest way to catch metric gaming before it becomes a pattern.
Tactics That Actually Reduce First Response Time
Not every fix carries equal weight. Structural changes to how tickets flow through your team beat individual agent effort almost every time, so prioritize in this order.
Fix the plumbing first. Consolidating every channel, email, chat, social, and messaging, into a single unified inbox is the highest-use change most teams can make. Zendesk’s tactical guidance points to unified inboxes and skills-based auto-routing as the structural changes that move FRT the most, because they eliminate the time tickets spend sitting unassigned or bouncing between agents who lack the right context. Skills-based routing works by tagging agents with expertise areas and routing tickets accordingly, which removes the reassignment delay that happens when a generalist picks up a ticket they can’t actually solve.

Add SLA breach alerts on top of routing so a ticket approaching its deadline pings a supervisor automatically, rather than getting discovered during a weekly review three days too late.
Then work on agent productivity:
- Build 10 to 20 high-quality response templates for your most common ticket types, written to sound human, not robotic
- Use text expansion shortcuts so agents aren’t retyping the same explanation five times a day
- Maintain a searchable internal knowledge base so agents aren’t pinging a supervisor for answers that already exist
Staff to the actual volume curve, not to a flat headcount number. Ticket volume has predictable peaks, Monday mornings, post-holiday returns, product launch weeks, and scheduling around historical intervals matters more than simply hiring more agents. Build in shrinkage (time lost to breaks, training, and meetings) when calculating coverage.
Automation and AI belong in the mix, with a caveat. Auto-triage, suggested replies, and AI-first responses can meaningfully cut FRT, but only when they actually resolve or advance the ticket. Aggregate 2025 to 2026 reporting on AI-assisted support shows median FRT dropping 37% to 55% where AI handles genuine triage and suggested replies, not where it just sends a generic “thanks for reaching out.” A tool like Emergent IT’s automation platform can handle ticket prioritization and auto-triage in a way that frees agents to focus on the messages that actually need judgment.
It’s adding a review step. Measure edit rate before you count AI as an FRT win.
Two anti-patterns to kill immediately: don’t count auto-acknowledgments as first replies, and don’t let agents close tickets prematurely just to make average close time look better. Both practices show up as “improved” metrics on a dashboard while customer experience gets worse.
SLA Targets and How to Monitor Them
An SLA without monitoring is just a hope. Build tiers by priority and impact, then attach a specific FRT target to each one.
A workable tier structure looks like this: Priority 1 (system down, revenue-blocking) gets a 15 to 30 minute FRT target across chat and phone, with resolution inside 4 hours. Priority 2 (significant but not blocking) gets a 1 to 2 hour FRT target with resolution inside one business day. Priority 3 (general questions, minor issues) gets a 4 to 24 hour FRT target depending on channel, with resolution inside 2 to 3 business days.
Your dashboard needs to show more than one number to be useful:
- Median FRT by channel, updated daily
- P90 FRT, to catch the worst-case tail
- SLA attainment percentage, tracked against each priority tier
- Average speed of answer (ASA) and call abandonment rate for phone
- CSAT scored per resolved ticket
- FCR rate to catch tickets that “resolved fast” but reopened
Configure time-based alerts that fire at 50% and 80% of the SLA window, not just at breach. A supervisor who gets a heads-up at the halfway mark can reassign a stuck ticket before it becomes a broken promise. Pair every alert with a short escalation playbook: who gets notified, what authority they have to reassign or expedite, and how fast they need to act once the alert fires.
Quick Wins: A Two-Week Response Time Action Plan
- Day 1 to 3: Turn on an autoresponder that sets a specific expectation (“we reply within 4 hours during business hours”), write 10 canned replies for your top ticket types, and enable SLA breach alerts.
- Day 4 to 7: Pull your median and P90 FRT by channel. Find the single biggest source of delay, usually unassigned tickets sitting in a queue, and test one fix.
- Week 2: Pilot a unified inbox or a single auto-routing rule for your highest-volume ticket type, and run AI-suggested replies on a small percentage of tickets to measure real edit rates before wider rollout.
Why Faster Replies Build Customer Loyalty
Speed shapes how a customer feels about your entire business, not just about the support interaction itself. A slow first reply reads as neglect even when the eventual fix is solid, and customers rarely separate “the product broke” from “nobody cared for six hours.”
The loyalty effect compounds over time. A customer who gets a fast, accurate reply once is more likely to reach out again instead of churning silently, and more likely to recommend you to a colleague. A customer who waits 12 hours for an email reply starts shopping for alternatives while they wait, whether they intend to or not.
This is where the CSAT-versus-resolution-time research gets genuinely useful for prioritization. Because FRT correlates more strongly with satisfaction than resolution time does, a support team with limited resources should protect the speed of the first reply even if it means the final fix takes a bit longer. Customers forgive a slow fix far more easily than they forgive being ignored.
Loyalty erosion from slow response times rarely shows up as a complaint. It shows up as a quiet non-renewal, a one-star review that mentions “no one got back to me,” or a customer who simply stops opening your emails. By the time it’s visible in churn numbers, the damage happened months earlier.
How Response Time Drives Churn, NPS, and Revenue
Support response time isn’t a soft metric that lives in a customer service silo. It shows up directly in the numbers a business owner actually watches.
Churn is the most direct link. Slow support is one of the few churn drivers a company controls almost entirely on its own, unlike pricing pressure or competitor moves. A customer who submits a billing question and waits a day and a half for a reply has already started evaluating whether to renew.
Net Promoter Score (NPS) tracks willingness to recommend, and support interactions are disproportionately memorable, especially bad ones. A single slow, frustrating support ticket can undo months of otherwise positive product experience, because customers weight recent negative interactions heavily when asked whether they’d recommend you.
Revenue feels the effect in two directions. On the retention side, faster support protects renewal revenue directly. On the expansion side, support interactions are often where upsell and cross-sell conversations happen naturally, an agent who responds fast and solves the actual problem earns the credibility to suggest a plan upgrade, while an agent who takes two days to reply gets no such opening.
For businesses managing physical devices and IT assets alongside customer support, that same speed principle applies to asset turnover. A slow, drawn-out process for retiring old fleet devices ties up capital the same way a slow support queue ties up customer goodwill, which is part of why bulk device buyback programs exist as a faster alternative to sitting on retired hardware.
Tools for Tracking Response Time Trends
You can’t manage what you don’t measure consistently, and most help desk platforms today, whether that’s a ticketing system, a live chat tool, or a unified inbox, come with built-in reporting for FRT, resolution time, and SLA attainment.
The functionality that actually matters for a growing team is trend visibility over time, not just a snapshot. A dashboard that shows median FRT flatlining while ticket volume climbs 30% tells you something a single-day report never will: you’re one seasonal spike away from a real breach. Look for reporting tools that let you segment by channel, by agent, by ticket priority, and by time of day, since response time rarely degrades evenly across all four.
Cohort analysis is underused here. Comparing FRT for tickets filed on Monday morning against Thursday afternoon often reveals a staffing gap that a flat weekly average completely hides. Similarly, breaking FRT down by individual agent (carefully, and without turning it into a public shame board) surfaces coaching opportunities faster than a team-wide number ever could.
Set up automated weekly reports rather than relying on someone remembering to pull a manual export. A report that lands in a manager’s inbox every Monday morning, showing median FRT, P90, and SLA attainment against the prior week, keeps response time visible without requiring anyone to go looking for a problem that’s already compounding.
Coaching Agents to Respond Faster Without Cutting Corners
Speed is a skill, and like most skills it responds to specific coaching rather than general encouragement to “move faster.”
Start with template fluency. Agents who have internalized their top 10 to 20 response templates, not just copy-pasted them but actually know when each one applies, respond measurably faster than agents hunting through a knowledge base mid-conversation. Run short weekly drills where agents practice matching ticket types to the right template in under 30 seconds.
Shadow the fastest performers. Every support team has one or two agents who consistently beat median FRT without sacrificing quality. Record how they triage an inbox, what shortcuts they use, and turn that into a documented workflow other agents can copy rather than leaving it as unspoken tribal knowledge.
Coach on triage decisions, not just typing speed. A lot of slow response time isn’t typing lag, it’s an agent unsure whether to escalate, unsure which template applies, or waiting on a teammate to confirm something they could have decided themselves. Give agents explicit decision rules for the ambiguous cases that eat the most time.
Tie coaching to real numbers, not vibes. Review each agent’s median FRT and P90 monthly, in a one-on-one setting, alongside their CSAT scores side by side. An agent with a fast FRT and a low CSAT isn’t a speed success story, they’re a warning sign that quality is being sacrificed for the metric.
Speed vs. Quality: Finding the Right Balance
The fastest possible reply and the best possible reply aren’t always the same message, and treating speed as the only goal creates its own failure mode.
A reply sent in 90 seconds that misdiagnoses the problem costs more time overall than a reply sent in 6 minutes that solves it correctly, because the customer now has to explain the issue twice and trust drops on the second round. This is exactly why resolution time and FCR need to sit next to FRT on every dashboard. A team optimizing FRT alone, without watching FCR, will eventually produce a pattern of fast, shallow, wrong replies.
The fix isn’t choosing one metric over the other, it’s sequencing them correctly. Speed matters most for the acknowledgment, the customer needs to know quickly that someone is on it. Quality matters most for the actual answer, and a slightly longer wait for a correct, complete response beats an instant reply that generates a follow-up ticket.
Practically, this means templates and automation should handle the acknowledgment and triage layer fast, while agents get the time they need on genuinely complex cases without a stopwatch pressuring them into a rushed, wrong answer. Build your SLA tiers to reflect this: simple, templatable questions get tight FRT windows, while complex technical issues get a realistic window that protects both speed and accuracy.
The Real Lever Behind Faster Support (An Editorial Take)
Most FRT problems aren’t staffing problems, they’re routing and measurement problems dressed up as staffing problems. Teams add headcount to fix a queue backlog before checking whether tickets are simply bouncing between agents who can’t solve them. Fix the routing first. The math almost always favors it over hiring.
At Buybackbear, that measurement discipline matters just as much on the operations side as it does in a support queue. Every device gets wiped to the NIST 800-88 standard with a documented Certificate of Data Erasure, because a process that isn’t measured and audited the same way every time eventually drifts, whether it’s a data wipe or a support SLA. The parallel holds: measurement honesty, median plus P90, business hours, no gaming the pause clock, is the unglamorous work that actually moves the number.
, Andy
Sources
- First reply time: 9 tips to deliver faster customer service
- 7 ways to reduce customer service response times (and keep customers happy)
- Response Time Benchmarks 2026: 5 Channels + 6 Industries
- Average resolution time (MTTR) guide
- 20 Customer Support Benchmarks for 2026
FAQ
How long does support take to respond?
A typical email response takes around 4 hours by median, though the industry average runs above 12 hours; live chat should answer within 30 to 60 seconds and phone support within 20 to 60 seconds.
What is a typical response time?
For email, a typical (median) first response time is close to 4 hours across industries, while live chat typically runs under 2 minutes and phone answer speed sits between 20 and 90 seconds.
What is a good average response time?
A good target is under 4 hours for email, under 60 seconds for live chat, and 20 to 60 seconds for phone answer speed, with best-in-class teams beating all three ranges.
What is a good SLA response time?
A workable SLA sets 15 to 30 minutes for urgent, revenue-blocking issues, 1 to 2 hours for significant but non-blocking issues, and 4 to 24 hours for general questions, always measured by median with a P90 tracked for worst-case visibility.
Recommended
Ready to sell?
Get an instant quote, free prepaid shipping, and fast cash that beats carrier trade-in credit.
Selling your device here, at a glance
Get my instant quote →- Instant quote in about 30 seconds, price locked while you decide
- Cash by PayPal, Zelle, Venmo or check after inspection, no fees
- Free prepaid label both ways, free return shipping if you decline
- We beat any competitor's written quote by $2
- Cracked screen, broken or won't power on? Still worth real money
- Certified NIST 800-88 data wipe with an emailed certificate
- Trade-in value paid in cash, not a 24-36 month carrier bill credit
- Every model priced: unlocked or carrier-locked, any storage size